Nov 2021-Small project using Excel
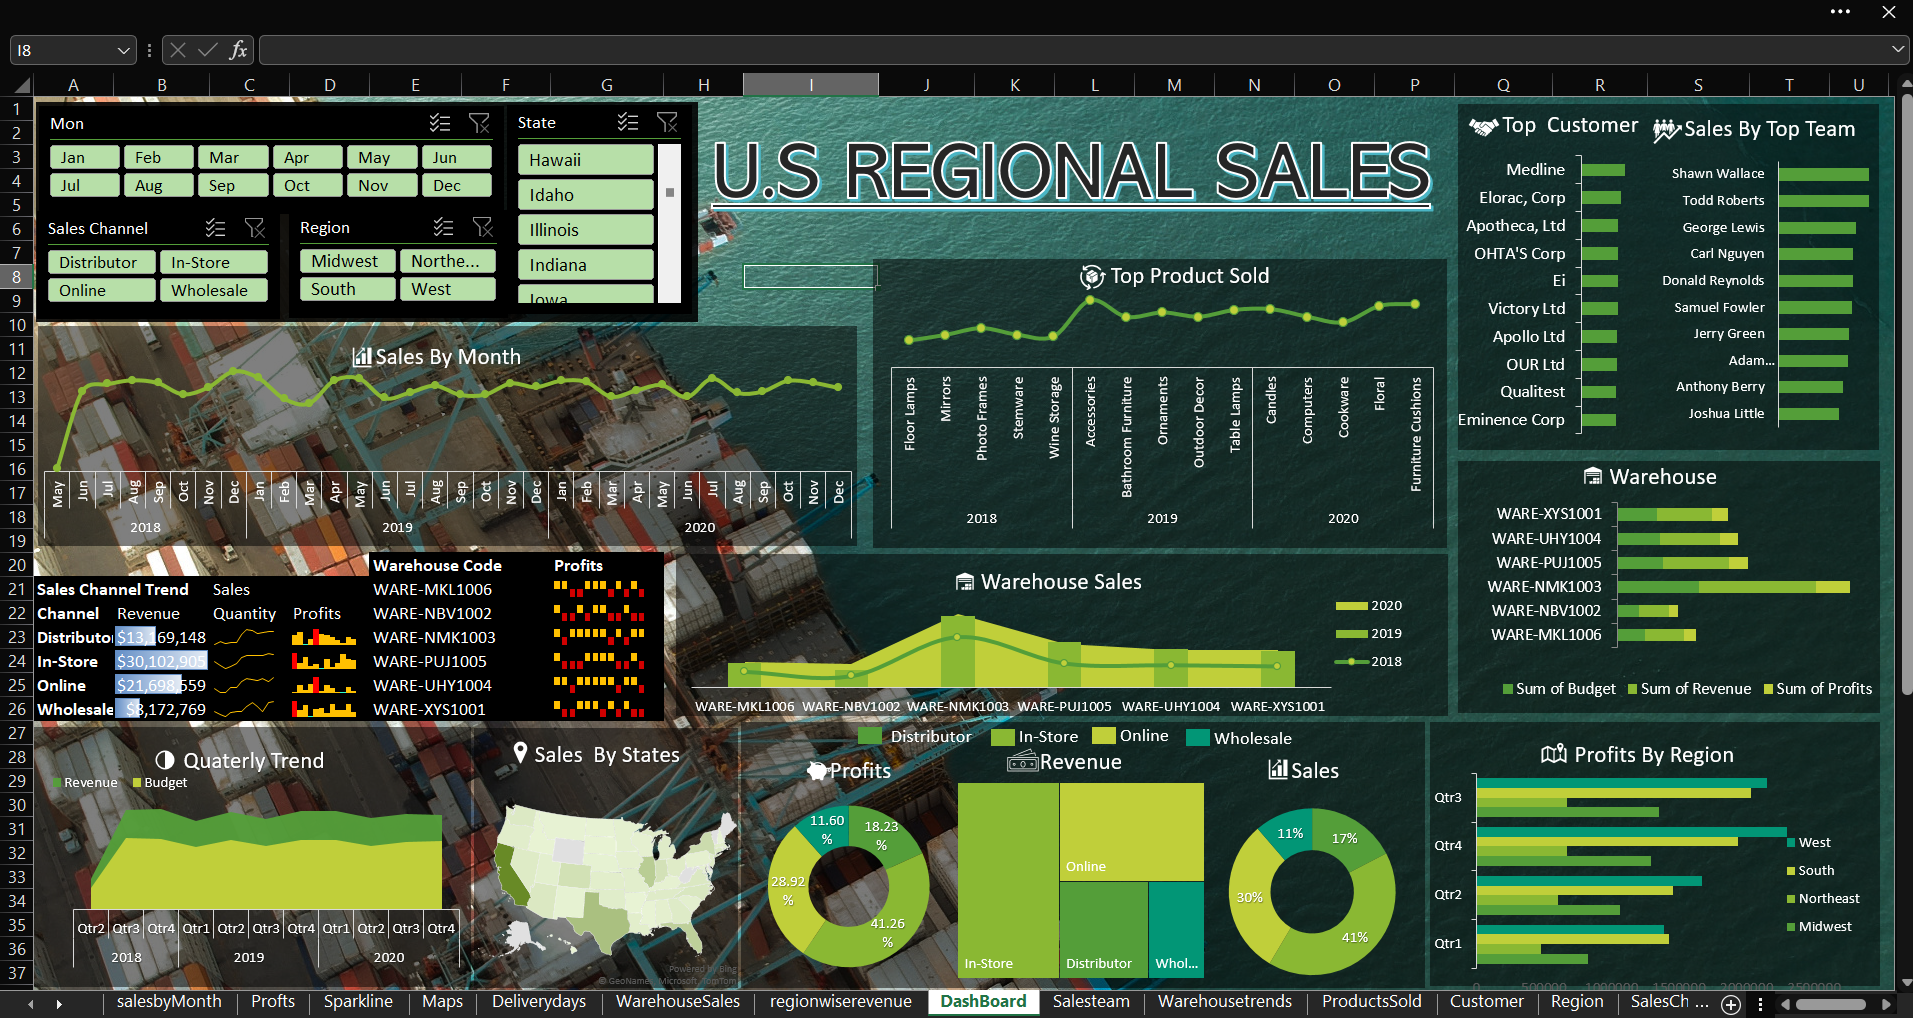
Made a dashboard using excel and functions. An overview of the dataset made into the dashboard showing important fields.
The final dashboard made from the data set should contain following objectives.
Do you like working with data? Then excel will be a blessing for you! Microsoft Excel is a modern tool used in day to day life for data management in a very easy way. Excel has a vast variety of services that are used in regard of data management, representation, and presentation. An Excel spreadsheet can be understood as a collection of columns and rows that form a table.
Alphabetical letters are usually assigned to columns, and numbers are usually assigned to rows. The point where a column and a row meet is called a cell. The address of a cell is given by the letter representing the column and the number representing a row. These are some basic things you need to know before starting out with excel.
The dataset should be easily understandable in the sense of calculating the extra columns from the given data columns. The dataset should be understood first before working on it. The sales dataset used in the project had a wide variety of fields to work on. The fields include sales, dates, costs, price, and customer related etc. All these fields are important as they are the main content of the whole dataset. The dashboard should showcase its nature in the sense of attractiveness, user friendly design, and should not contain unnecessary data. The problems faced during creating a dashboard can be a little bit tiring. It includes what fields to choose for the chart, what chart to use, what filters should be applied etc. 9
PROJECT REPORT